Strategy Canvas
Problem
Traditional strategy tools are designed around outputs.
Organizations create:
- Brand strategies
- Marketing strategies
- Content strategies
- Media plans
- Business cases
The final deliverable is usually a deck, report or canvas.
While these formats communicate decisions, they rarely preserve the thinking that produced them.
Questions such as:
- Which assumptions does this strategy depend on?
- What information is still missing?
- Where do stakeholders disagree?
- Which risks matter most?
- What happens if budgets change?
- What happens if our assumptions are wrong?
often remain difficult to answer.
The Concept
Strategy Canvas replaces documents with a visual graph.
Every strategic element becomes a node.
Examples include:
Facts
- Market share
- Revenue
- Customer retention
- Brand awareness
Assumptions
- Customers see us as expensive
- Awareness limits growth
- Competitors outspend us
Resources
- Budget
- Team
- Channels
- Technology
Risks
- Competitive reactions
- Budget cuts
- Market changes
Unknowns
- Missing research
- Evidence gaps
- Unanswered questions
Strategic Choices
- Premium positioning
- Market expansion
- Brand investment
- Performance-first growth
These nodes are connected into a structured representation of strategic thinking.
Scenario exploration feature
Once a model has been built, different strategic scenarios can be explored.
For example:
Conservative
Lower investment, lower risk.
Balanced
Moderate investment and expected growth.
Aggressive
Higher investment with greater upside potential.
Transformational
Large strategic bets with significant uncertainty.
Rather than producing multiple disconnected presentations, teams can explore how changes in assumptions, resources or market conditions affect outcomes.
Making uncertainty visible
One of the core ideas behind Strategy Canvas is that uncertainty should be documented rather than hidden.
Most organizations document what they know.
Few document what they do not know.
Strategy Canvas introduces dedicated nodes for:
- Unknown information
- Weak assumptions
- Stakeholder disagreements
- Evidence gaps
The goal is not to remove uncertainty but to expose it.
Better decisions often come from understanding what remains unknown.
Outputs
The graph is the source of truth.
From a single strategic model, Strategy Canvas can generate:
- Strategy canvases
- Executive summaries
- Board presentations
- Marketing plans
- Agency briefs
- Workshop materials
Different audiences receive different views while working from the same underlying model.
Technical approach
Frontend
- React
- TypeScript
- React Flow
Backend
- Django
- Django REST Framework
Database
- PostgreSQL
Future Exploration
- Scenario simulation
- Using Go for additional tooling and connections to cloud
- Confidence scoring
- Stakeholder modelling
- Recommendation systems
- Monte Carlo analysis
- AI-assisted narrative generation
The focus remains on structured thinking first and automation second.
Why I'm building it
After years working in strategy, branding and marketing, I have repeatedly encountered the same problem.
Organizations rarely struggle to generate ideas.
They struggle to make assumptions, trade-offs, disagreements and decisions visible.
Strategy Canvas is an attempt to transform strategic thinking from a collection of documents into a system that can be modelled, explored and communicated.
Because strategy should be more than a presentation.
It should be something you can understand, challenge and improve.
Three stages
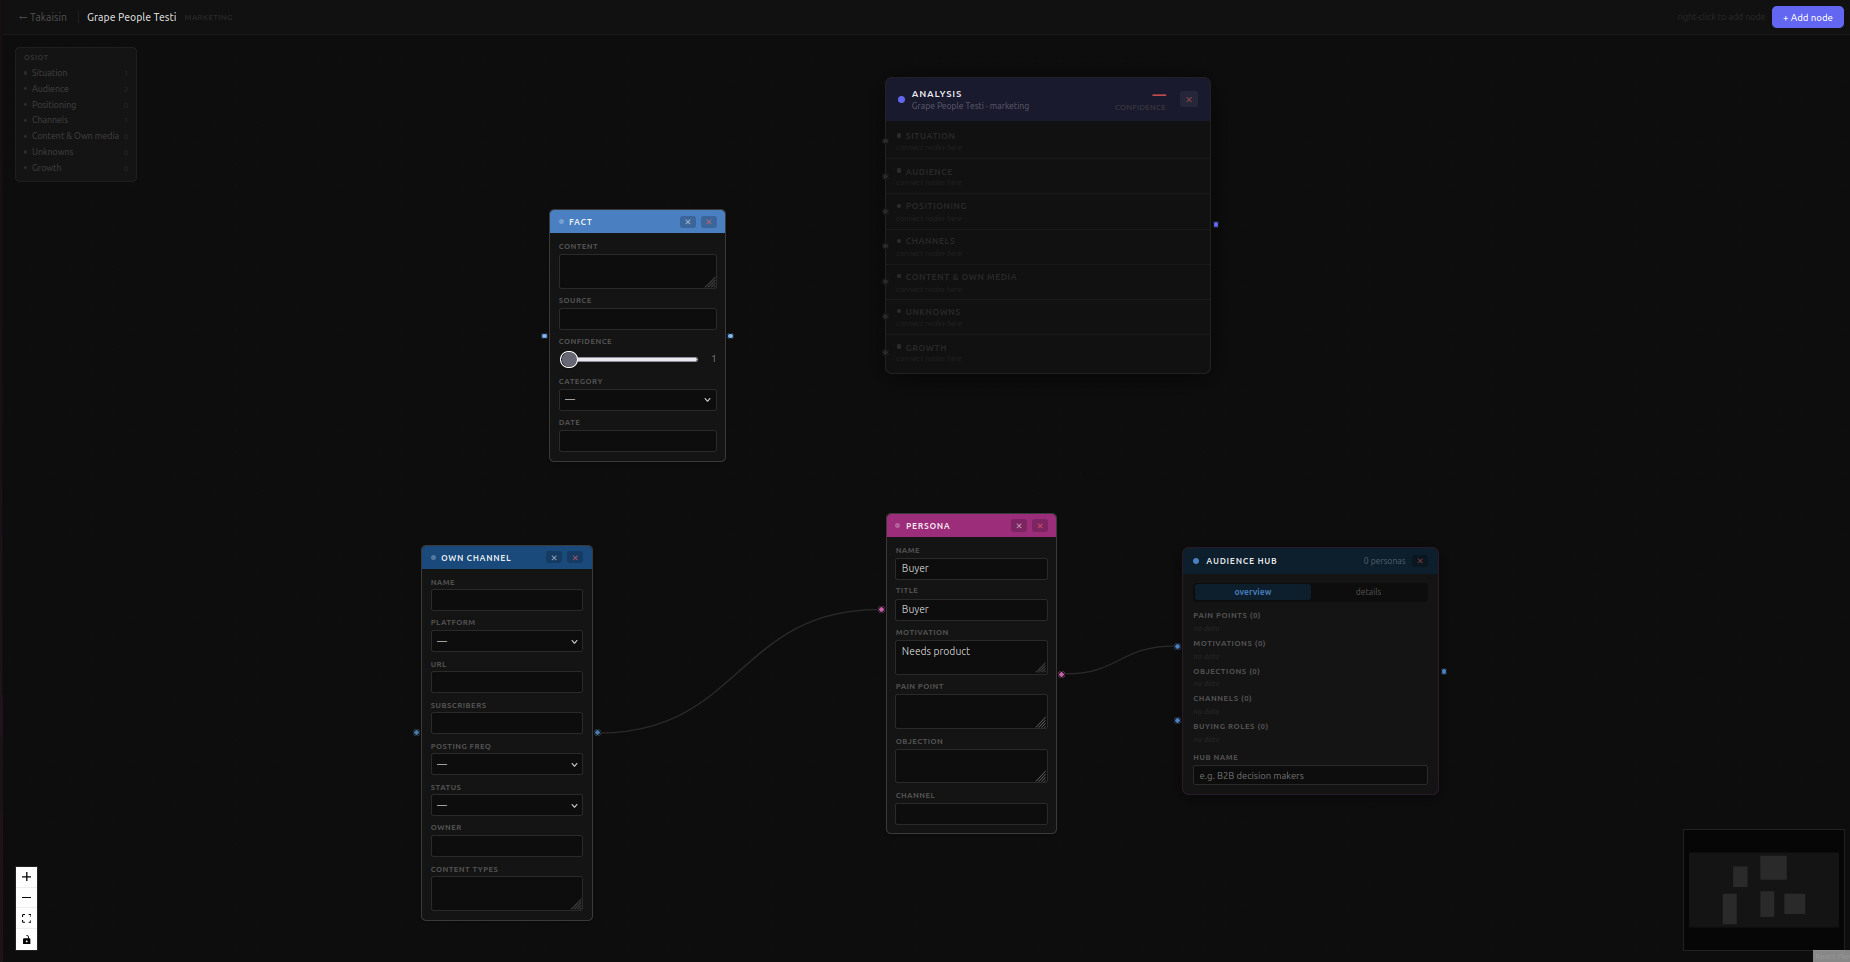
The canvas works in three stages. In the first — Analysis — the user builds a map of the market: facts, threats, strengths, uncertainties, segments, and signals, each carrying weight in the form of confidence scores, impact estimates, and probability ratings. The Analysis node aggregates these into a structured picture of the market as currently understood. In the second stage — Strategy — the user forms a hypothesis: a set of choices, positioning decisions, and resource allocations that respond to the map. This is where the node editor earns its keep. The third stage is Scenario modeling: without rewriting the canvas, the user can toggle nodes, adjust weights, and introduce black swan events to test the hypothesis against different versions of reality — base case, best case, worst case, or a low-probability disruption that the base model treats as background noise but which, when foregrounded, changes what the strategy needs to say. The graphical node-based UI makes this manipulation visible and tactile. You can see which nodes are driving the confidence score, which uncertainties are suppressed in the current scenario, and what happens to the Summary output when you change the assumptions underneath it.
Build log
June 25, 2026 - beginnin a BIG PROJECT
Built the core node editor for CanvasOS, a node-based strategy canvas tool. The fundamental UX decision of the session: nodes are inline forms on the canvas, not popups — edit mode opens on add, collapses to a view card on click-away, reopens on double-click. Blender node editor model. Stack is React 18 + TypeScript + Vite, FastAPI + Python 3.12, PostgreSQL 16, Docker Compose.
Most of the session was spent resolving cascading bugs: duplicate nodes from a stale useEffect on the store, addNode returning void instead of the created node record, a misplaced return data statement landing inside the wrong function after a sed operation, and 500 errors from frontend-only nodes (analysis, summary-*) being sent to the backend edge persistence endpoint. Each fix exposed the next. The audience architecture also required several iterations — Segment and AudienceHub ended up as peers that both connect directly to the Analysis audience slot, with no automatic inheritance between them.
The session's main conceptual output was the three-layer information flow: nodes hold raw data, Analysis aggregates it into typed slots (situation, audience, positioning, channels, unknowns, growth) and calculates a confidence score, Summary reads only from Analysis and generates structured Finnish-language marketing strategy text. When a field changes in any node, the update propagates in a single setNodes call: node → Analysis slots → Summary connectedNodes. An edgesRef pattern solves the stale closure problem inside field change handlers. Full persistence across reloads: regular node positions via PATCH /nodes/{id}/position, frontend-only node positions via a ui_state JSONB column on the canvas record.
The tool is now testable end-to-end. Add nodes, connect them to Analysis, connect Analysis to Summary, watch the strategy text generate and update in real time. Next: realistic canvas test with a full Acme Oy marketing strategy, channel picker component, and Mistral API for summary (or OpenAI or Claude)